Our predictive efforts aim to address two tasks: determining the factors that “explain” variation in social media outcomes (clicks, retweets, likes, etc.) and identifying methods for predicting those outcomes in advance. We only considered variables that would be known to organizations at the time that they post their stories (e.g., we did not attempt to predict clicks using retweets). CS 109 focused most on supervised classification methods, so we took this opportunity to learn more about and implement several regression models.
The content on this page derives from source code in our repository. See our predictive model generation notebook for generation and comparisons of models. Several other notebooks contain information about strategic implications surrounding post timing, media (photos/videos that accompany posts), and sentiment (you may wish to review our sentiment analysis overview).
Predictive Models What can we predict?
When fitting models, we focused our efforts on Ridge Regression and Random Forest Regression models. Due to fundamental differences between both social networks (and their asymmetric featuresets), we fit separate models between both networks when predicting clicks.
Predicting Clicks
Though it is important to not treat pageviews as the sine qua non of engagement on social media, they are a primary measurement of success in social media promotion. News organizations are ultimately “selling” their content, and influencing readers to consume it is a challenge in the age of social media. To attempt to ascertain what drives link traffic, we treated Bitly clicks as our dependent variable and fit a number of (potential) explanatory features. It bears noting that Bitly clicks are not a perfect proxy for link traffic in all cases: many links are posted without Bitly links, and we are unable to observe their traffic.
Some features that we selected for modeling:
- Time of day (with appropriate oscillation functions) and day of week;
- Organization information (publisher dummy variables, audience size measures)
- Sentiment scores and classifications;
- Associated "media" information (whether or not the post has an associated photo or video).
This section focuses on the model fitting process. Notable features are discussed in our strategic findings below.
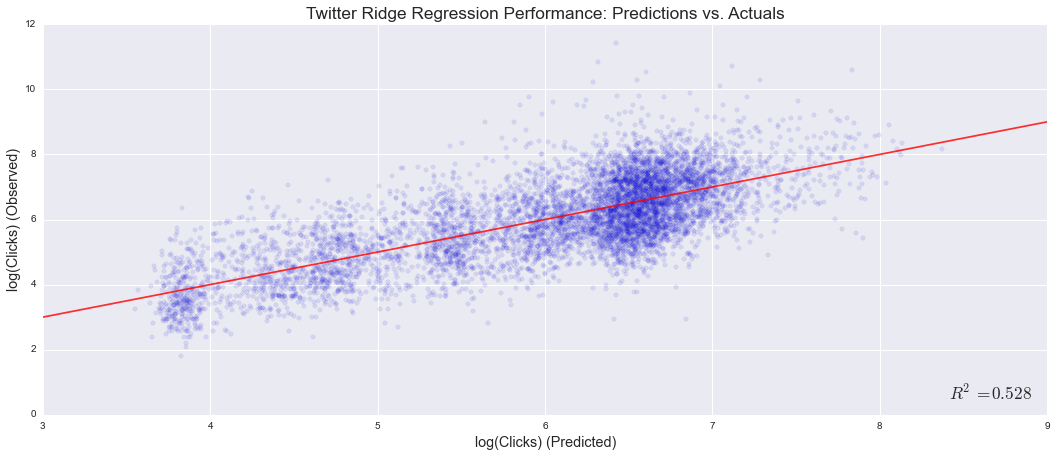
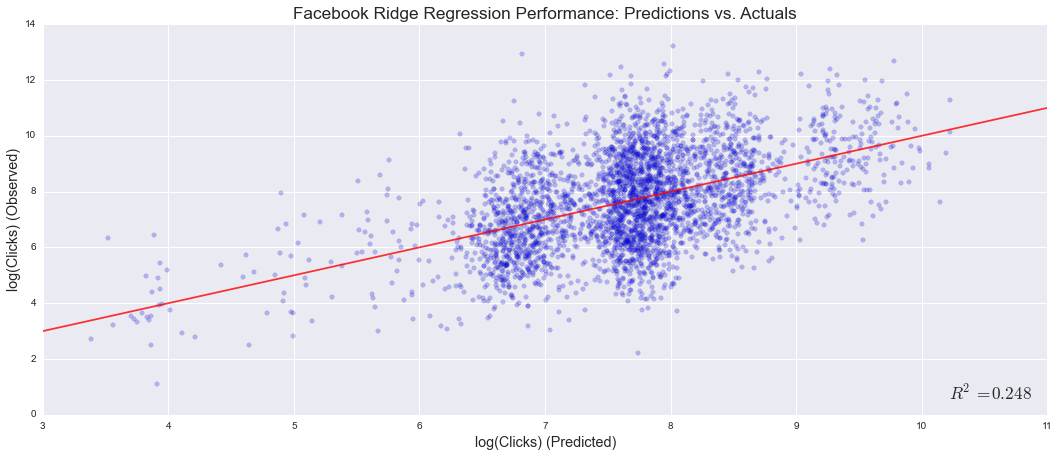
Fit statistics for each model against held-out testing data (10% of the dataset) are as follows. Note that clicks feature a long-tailed distribution that necessitated log transformation for regression (transformed values are approximately normally distributed).
| Model | Social Network | R2 | Mean Absolute Error (Log Scale) |
|---|---|---|---|
| Ridge Regression | 0.528 | 0.707 | |
| 0.248 | 1.202 | ||
| Random Forest | 0.509 | 0.706 | |
| 0.248 | 1.226 |
Given the similarities in feature set between Twitter and Facebook models, we expected similar results. Instead, the Facebook model drastically underperformed the Twitter model. Our best theory is that Twitter's reverse-chronological timeline provides more consistent outcomes, while Facebook’s algorithmic system (that selectively displays content, based only partially on its age) introduces variability that we cannot capture. Further, our naïve intuition held that the Random Forest model would outperform the linear regression model; that turned out to not be the case.
Though the R2 from our Twitter model might be considered respectable, a typical estimate still misses the actual click count by approximately 70% (given the log transformation). The following charts visualize this performance, comparing predicted values to actual outcomes:
Predicting Retweets & Likes
In an effort to reach beyond pageviews as measure of social success, we attempted to “recycle” out featureset and use it to predict (1) Twitter retweets and (2) Facebook likes. Both services have alternative measures of engagement (Twitter favorites; Facebook shares and comments) that would make for interesting modeling, but these two are oft-considered the two most important for engagement. As one might expect, they also correlate closely with clicks: each comparison features a correlation coefficient of approximately 0.6.
Given strong correlation, we were not particularly optimistic about obtaining strong predictive power. Our retweet model validated that concern, and featured accuracy roughly in-line with the predictive models above.
Our effort to predict likes produced some surprising results:
| Model | R2 | Mean Absolute Error (Log Scale) |
|---|---|---|
| Ridge Regression, Facebook Likes | 0.542 | 0.863 |
These results proved far more promising than our Facebook click model. A causal theory is discussed with our “strategic findings” below.
Strategic Findings What can publishers do with this information?
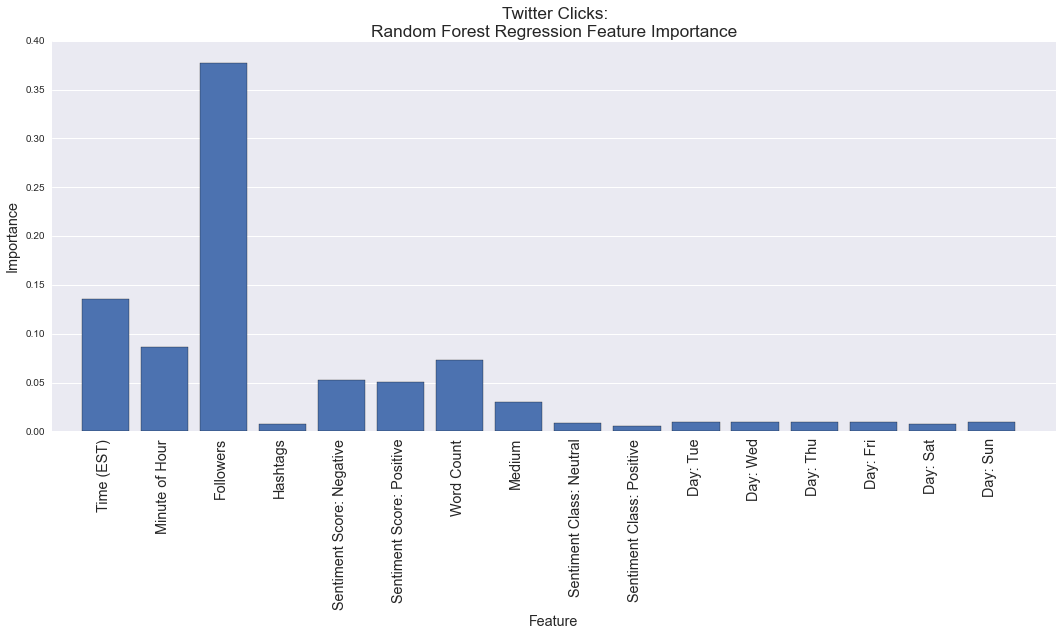
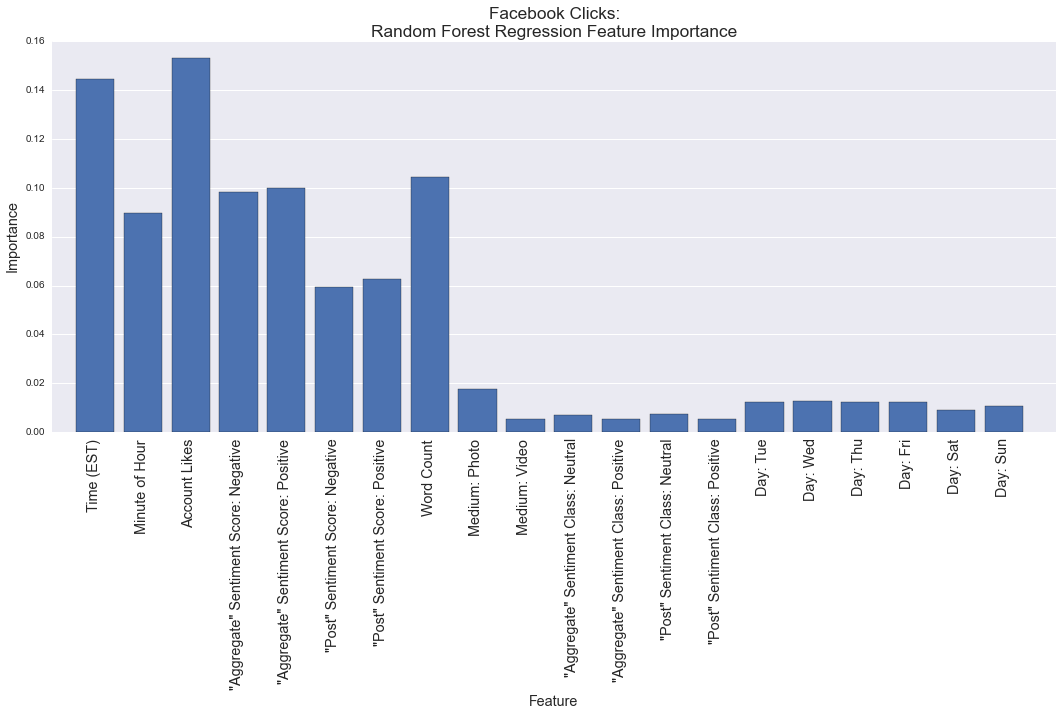
Our Random Forest models assign the following rankings to Twitter and Facebook posts when predicting clicks. Logistic regression features are somewhat more complex and will be discussed as needed below.
Post Timing
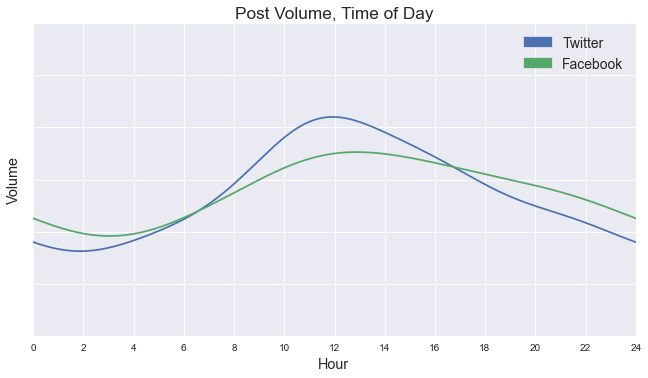
The importance of post timing is clear on the plots above: only audience size is judged more important for predicting link performance. Prior analysis shows that posting activity on both networks tends to peak around 12:00 p.m. Eastern:
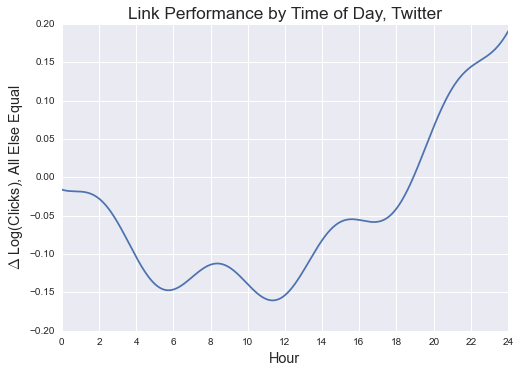
But is this practice efficient? Some news organizations post somewhat consistently at all hours of the day; others appear to adhere rigidly to working schedules. Our Ridge Regression model offers us the opportunity to hold all else but time of day constant, and predict link traffic based on when an arbitrary post was published.
Notes on Interpretation
The proportional difference in expected link traffic between posting at two times (on either line) is the difference in those points’ y-axis values.
Notes on Fit
Regression (not Random Forest) models were fit using both sine/cosine and third-degree polynomial terms for time of day and rely on the OLS method and regularization process to determine the important combinations thereof.
Including all terms enables description of cyclic effects. The strongest model was fit using both categories of terms, and manual inspection of models that left out either group showed counterintuitive (and weakly predictive) results.
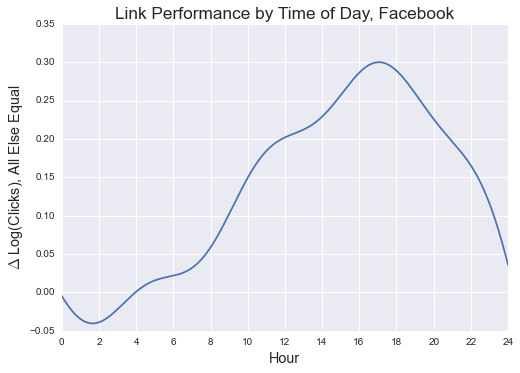
The time effect for Twitter does not look great, as it does not appear to maintain cyclicality between 11:59 p.m. and midnight. The Facebook model looks much more promising.
To understand the magnitude of this effect, consider two times: a Facebook post at 6 p.m. is expected to receive 26% more clicksg than the same post at 6 a.m. (0.289-0.021).
The above suggests that (1) some organizations that post heavily at night might benefit from reconsidering their posting strategies, and (2) news organizations may be forgoing valuable traffic by “peaking” too early in the afternoon. Still, there are two key objections to either conclusion:
- This may be a case of reverse causality. Publishers may be "dumping" low-impact stories on off-peak hours. Those stories might not attract attention during peak hours anyway.
- Publishers may simply be reposting stories at night and other off-peak hours, and are already posting important material at times that better maximize click traffic.
Unfortunately, we are not confident that our prediction dataset can detect the first phenomenon, and it remains a critical consideration when applying this analysis to posting strategy. Incorporation of topic modeling into our predictive models may help, but has not been attempted. We can, however, use URL information to determine if “graveyard shift” posts are reposts. The following chart measures reposting activity for both networks, comparing content posted between midnight and 6am to the rest of the day:
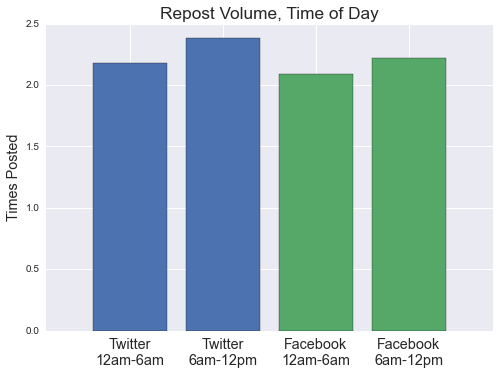
Repost volume appears to differ little between the two time periods and favors a view that valuable, original content is being wasted through maltimed posting. But the first objection above (about news "dumping") remains valid (these may be inherently low-value stories), and further analysis ought to address it. Still, from the observed posting schedules, many organizations appear apt to post news stories according to their own workdays. Evidence suggests that they might benefit from a more data-driven strategy.
Interestingly, this analysis differs somewhat from Bitly’s analysis of the same topic. Their analysis found the same (intuitive) effect for late-night/early-morning posts. But our "peak" time range for predicting link traffic on each network fell later in the afternoon/evening. There are many possible reasons for this discrepancy, including the other variables for which our model controls (Bitly's analysis does not appear to control for anything) and the very specific organizational and content focus of our analysis.
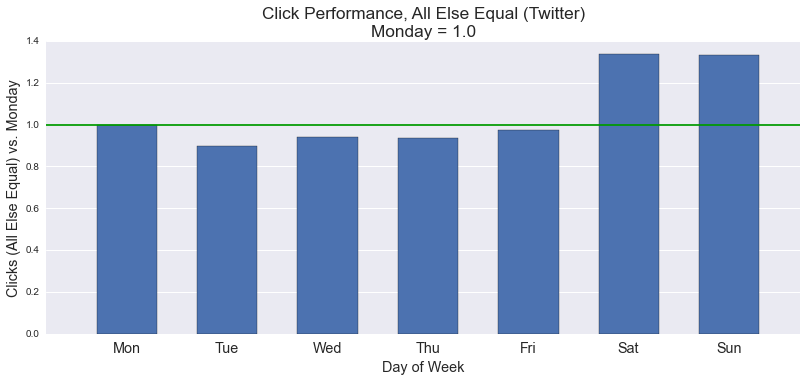
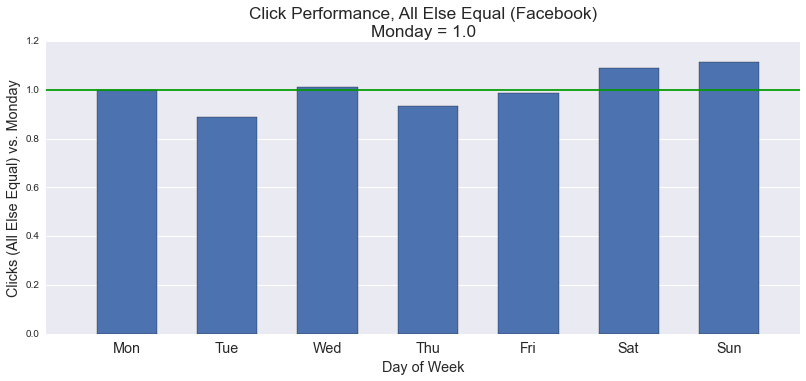
Posting Days
As our descriptive analysis shows, publishers tend to post little on weekends. Our linear regression and Random Forest models appear to disagree about the importance of this observation as it affects click outcomes. The Random Forest model above assigns little importance to day-of-week. In contrast, Ridge Regression estimates that weekend posts show predicted increases in clicks of anywhere from 9 - 40% (depending on the days compared). The following charts break down this predicted effect by day and by social network.
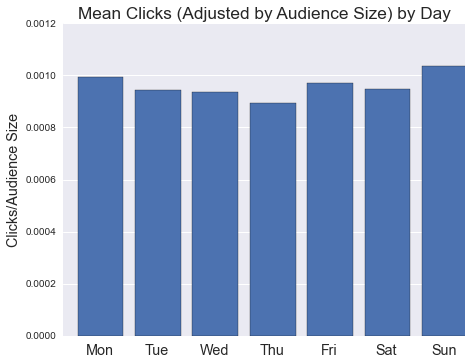
Aggregate data suggest advantages to posting on weekends as well. Controlling only for audience size, Sundays appear to be best for traffic, and Saturdays outperform several (but not all) weekdays:
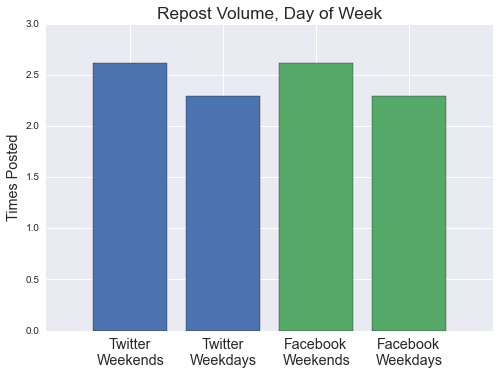
Of course, there are natural limits to the sorts of content that publishers can (or want) to post on weekends. As weekends are largely removed from traditional news and publishing cycles, organizations may be forced to carefully curate recent news stories, archival material, and feature reporting in order to successfully cultivate a weekend audience. Evidence shows that they are already reposting content more often on weekends:
In sum, publishers tend to post little on weekends, despite evidence of significant returns to doing so. Weekend posting thus appears to be a significant untapped source of potential web traffic. The unique nature of such news content may make a weekend posting strategy ultimately infeasible: perhaps the content available for posting on weekends is simply unattractive to readers. It may also be that the benefits of weekend posting are driven by the relative paucity of news content available on weekends: weekend posts have little competition (but for a smaller audience), and this strategy would not scale well under wide adoption. We are hopeful that future research (or publisher experimentation) may hold the final answer to this question.
Interestingly, our analysis once again differs from Bitly’s: they note a lull in aggregate click behavior on weekends. And as above, it must be noted that our analysis differs from theirs in our controls and our focus on news organizations.
Media on Twitter & Facebook
Facebook and Twitter (in varying ways) allow users to post photos and video with their content. The exact manner in which this changes user interaction with the post is dependent on the network, and has distinct implications for the number of clicks a link contained therein will receive.
Photos on Twitter
Twitter photos are primarily “complementary.” Consider the following from the New York Times:
36 hours in Dublin http://t.co/duuWzQndvG pic.twitter.com/E5eCtHcJI8
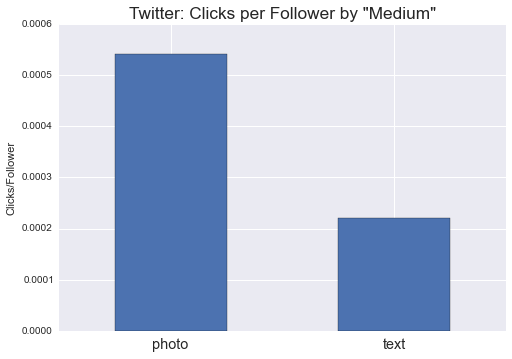
— The New York Times (@nytimes) November 17, 2014As observed, photos “accompany” tweets, which retain much of their prior appearance. They have enhanced placement in user timelines, and can be enlarged to show more content (offering another avenue of interaction to Twitter users). But what is this worth to a publisher? Our linear regression model can tell us. A post with a photo is estimated to garner 53% more clicks than the same post without a photo, ceteris paribus.
The aggregate data bear out this relationship. On average, tweets with photos receive far more link clicks per follower (to adjust for audience size) than those without:
Notably, this relationship also extends to predicting retweets (and thus potentially to measures of “virality”). In that model, a photo predicts a 51% increase in retweets.
Thus, in the aggregate and when controlling for other variables, photos thus appear as a major driver of link traffic. This phenomenon would make for a fascinating vector for future research.
Photos & Video on Facebook
Media (i.e., videos and photos) on Facebook are more interactive and constitute an interaction paradigm wholly apart from the links they accompany. Consider a Fox News video:

The link itself is de-emphasized, hidden under the virtual “fold” of the “See More” link. One might expect that Facebook videos (and photos, which function similarly) will show diminished click counts, all else equal. This is indeed the case: our linear regression model predicts an average 76% decrease in clicks for links published as part of posts that primarily feature a photo or video. This result is perfectly intuitive: if users cannot easily see links, they will not follow them. And aggregate data support this conclusion:
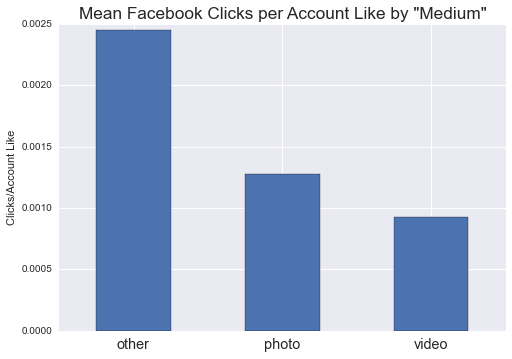
Non-photo and non-video posts (grouped into the “other” category) significantly outperform links with such media. And there appears to be little benefit to “likes” from such media-heavy posts, as our linear regression model predicts no significant gain in likes for such posts.
Still, it is reasonable to assume that publishers post videos and photos for a reason. At the time the screenshot of the above video was taken, it had achieved more than 100,000 views in three hours (according to Facebook itself). Even if videos do not necessarily lead to people visiting publishers” websites, it is clear that they garner engagement from Facebook users. The value of such interaction to each organization would make for a fascinating topic of further analysis. This problem recognizes that engagement now exists far beyond individual news organizations’ websites and apps, and illustrates the extent to which social media themselves have become new frontiers in audience engagement.